BIM analytics is the process of extracting, analyzing, and interpreting data from Building Information Models (BIM) to generate actionable insights for better decision-making throughout a building’s lifecycle. BIM has transformed how architects, engineers, and contractors manage building data, yet the growing volume of information demands smarter ways to extract value from it. By transforming raw model data into actionable insights, teams can make faster, evidence-based decisions and improve project outcomes.
To explore further, in this article, ViBIM will explain what BIM analytics are and how they work through five main stages, from data collection and cleaning to interpretation and continuous refinement. We also highlight how data analytics is reshaping BIM practice: improving cost control, optimizing workflows, enabling energy modeling, supporting clash detection, and simplifying project handovers. Finally, we discuss which industries benefit most and share ViBIM’s perspective on how data-driven modeling adds long-term value to construction projects and the future of BIM. Continue reading to learn how data analytics is shaping the future of BIM practice.
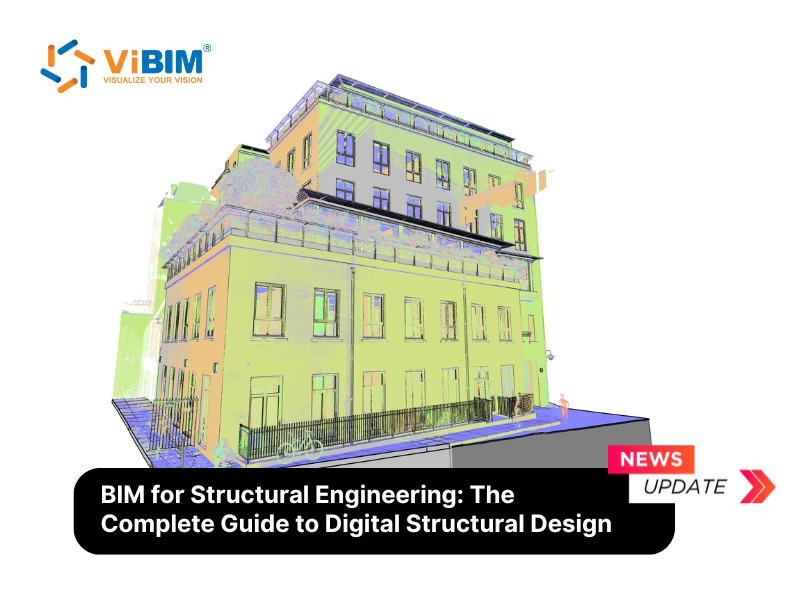
What is BIM Analytics?
BIM analytics is the process of extracting, analyzing, and interpreting data from Building Information Models to support informed decision-making throughout a project’s lifecycle. It converts raw BIM data, including 3D geometry, material details, costs, and timelines, into meaningful insights that enhance design quality, construction efficiency, and outcomes when using BIM in facilities management.
There are three key features of BIM analytics:
- Construction Data Insights: Identifies patterns and trends in project data to improve forecasting and risk management.
- BIM Analysis: Evaluates project performance metrics to support the BIM execution plan, better planning, execution, and collaboration across disciplines.
- Data-Driven Decision-Making: Empowers stakeholders with real-time, actionable insights to address challenges proactively and enhance project delivery.
With the help of advanced BIM analysis tools, construction teams gain a comprehensive view of their projects which allows them to optimize performance, minimize errors, and achieve greater overall success.
Benefits of BIM analytics
Data analytics is rapidly becoming the driving force behind smarter, faster, and more reliable Building Information Modeling (BIM) practices. By integrating analytics into BIM workflows, project teams can make better-informed decisions, improve coordination, reduce costs, and enhance the overall lifecycle management of assets. Below are six key ways data analytics is reshaping how BIM delivers value across design, construction, and operations.
Cost reduction:
Traditional processes depend on manual reviews of drawings, spreadsheets and field reports, which can hide redundancies or vague quantity takeoffs. With analytics-driven BIM, material, labour and cost data are extracted automatically and displayed through charts and graphs, giving teams instant visibility over waste patterns and budget shifts. Over time, machine learning tools reduce the need for manual interpretation, shorten data-processing cycles, and free BIM professionals to focus on higher-value insights rather than repetitive checking.
Improved efficiency:
Before BIM analytics, coordination relied heavily on static documents and siloed updates, slowing down scheduling and resource allocation. Now, unified models and configurable dashboards bring all project data into one place, streamlining BIM data management. Progress updates appear in real time, enabling teams to adjust workflows dynamically, resolve issues faster than specialist teams could traditionally manage, and keep large design packages aligned without days of manual analysis.
Enhanced resource management:
Project teams often work from separate reports or disconnected systems, which makes forecasting difficult and increases the risk of shortages or downtime. With BIM analytics, every material quantity, equipment update and labour allocation is centralised and continuously refreshed.
Dashboards track procurement needs at a glance and flag unnecessary order duplication. On one recent project, analytics revealed seven different concrete strengths were being ordered. Simplifying this to three strengths reduced ordering time, delivery costs and handling efforts. Visibility of all project data helps prevent bottlenecks and ensures supply management stays efficient.
Better risk mitigation:
Manual clash detection and design reviews can take days or weeks, delaying decisions and increasing the likelihood of expensive rework. Digital design tools have also increased geometric complexity, especially in architectural and infrastructure models. BIM analytics accelerates this process by identifying clash relationships early in the design phase, helping teams avoid common mistakes in bim implementation. Automated checks verify geometry, schedules and model logic continuously, reducing on-site delays and eliminating many issues before they reach fabrication or construction.
Sustainability:
Traditional sustainability assessments rely on separate energy simulations or rough estimates, limiting precision. This integration of BIM and sustainability ensures that energy use, waste outputs and material performance are monitored in real time, supporting greener design decisions. At the same time, automated model audits verify compliance against COBie, Uniclass, OmniClass or custom data standards. Instead of stressful, manual auditing cycles, automated checks can run at every project milestone, making it easier to ensure that all data meets contractual and operational requirements.
- Enhanced Project Handovers and Asset Management: Manual as-built documentation typically results in incomplete data, inconsistent formats, and painful handover processes for facility managers. With BIM analytics, as-built information is captured accurately throughout the project lifecycle. Integrated models—often updated via Scan to BIM for FM—support predictive maintenance, improve asset performance, and ensure smoother, more reliable transitions into operations.
How does BIM analytics works?
Performing BIM analytics involves a structured five-step process that converts complex model data into actionable insights. Each stage builds on the previous one to maintain data accuracy, clarity, and value for decision-making.
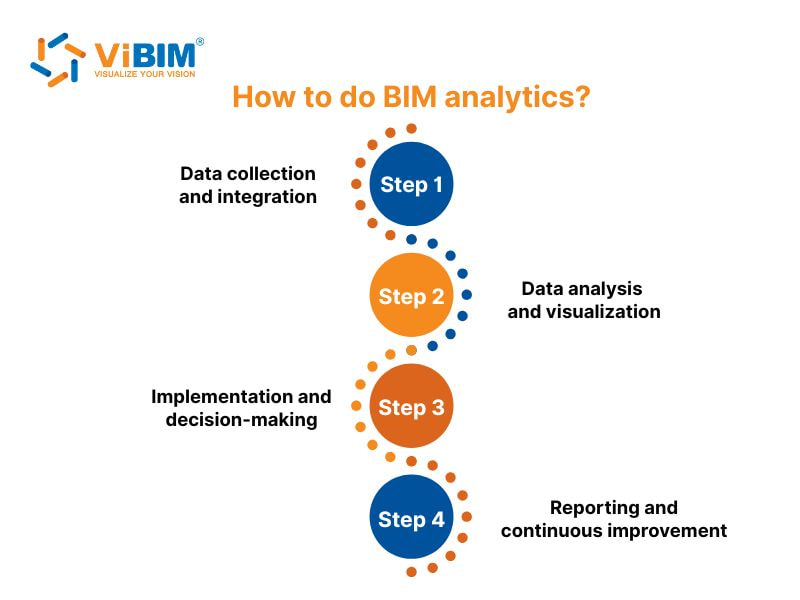
Step 1: Data collection and integration
BIM analytics starts with collecting and integrating data from multiple sources, including BIM models, project management systems, and IoT sensors. Data is extracted from platforms such as Revit, Navisworks, or Autodesk Construction Cloud — typically hosted within a CDE in construction — using integration tools or APIs. These datasets are then combined into structured formats (e.g., CSV or database tables), providing a clean and unified foundation for further analysis.
Step 2: Data analysis and visualization
Once data is collected, it is analyzed to uncover patterns, trends, and areas for improvement.
- Statistical Analysis: Identifies relationships and correlations within project data.
- Machine Learning: Predicts performance outcomes and detects potential risks.
- Data Mining: Discovers recurring issues or hidden relationships.
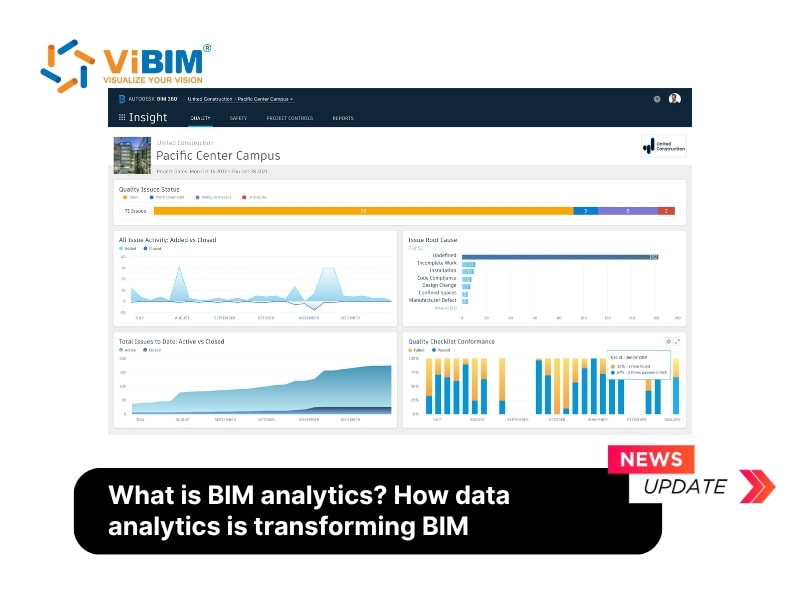
- Visualization Tools: Platforms like Power BI or Tableau create interactive dashboards to display key insights, such as cost tracking, progress updates, and risk levels, in a clear and actionable way.
Step 3: Implementation and decision-making
Insights from data analysis are applied to improve workflows, allocate resources efficiently, and mitigate risks. Project managers and stakeholders use these data-driven insights to make informed decisions, optimize schedules, and enhance overall project performance.
Step 4: Reporting and continuous improvement
Comprehensive reports summarize key performance metrics and highlight the impact of implemented changes. By continuously updating data sources and refining analytical models, teams ensure ongoing accuracy, relevance, and optimization across both current and future projects.
Here is a real, practical scenario showing how the BIM analytics process works in real project conditions
- Data collection and integration: Structural concrete data from Revit models is exported through Dynamo scripts and merged with actual on-site batching plant records collected via IoT weight sensors, forming a unified database of designed vs. poured concrete volumes for every slab, beam, and column.
- Data analysis and visualization: A data-mining algorithm compares Revit’s scheduled concrete quantities with daily pouring logs, automatically flagging floor zones where actual concrete usage exceeds design values by more than 8 percent and visualizing deviations on a color-coded Power BI floor map.
- Implementation and decision-making: The project team investigates flagged areas, identifies that formwork misalignment on Level 12 caused over-pouring around perimeter beams, and updates the construction workflow by adding pre-pour laser scanning checks to ensure accurate formwork alignment before each concrete placement.
- Reporting and continuous improvement: Weekly deviation reports document how corrective actions reduce over-pour from 8 percent to 2 percent across subsequent levels, creating a feedback loop that improves quantity accuracy, reduces material waste, and informs best practices for future high-rise projects.
To understand how the integration of real-time sensor data fundamentally distinguishes a dynamic operational asset from a static design model, read our detailed comparison of Digital Twin vs Bim.
BIM Analytics software
The following five software options represent common choices that support data extraction, simulation, and performance tracking across different project stages:
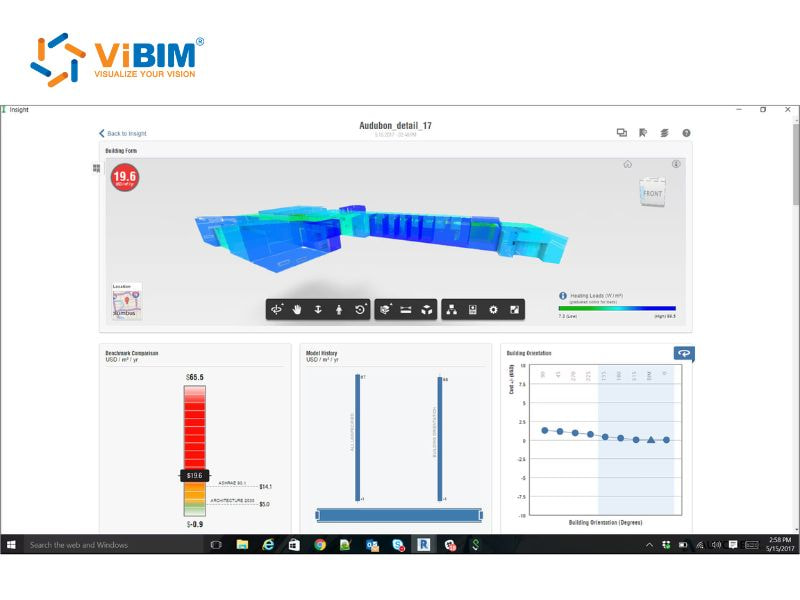
- Autodesk Insight: Dashboards in Autodesk Insight connect directly with Revit’s Energy Analytical Model and present visual simulations that track energy use, operational carbon and building performance. Data comparisons then help users refine design decisions with clearer environmental insights.
- SimScale: Cloud simulations in SimScale pull geometry from BIM models and run CFD, thermal or structural tests that support design validation. Result datasets then highlight airflow behavior, heat distribution or load responses to guide earlier adjustments.
- Autodesk Construction Cloud Insights: Data views in Autodesk Construction Cloud Insights gather model information, documentation updates and issue logs and arrange them into clear dashboards used throughout a project. Trend lines then help teams monitor progress and spot emerging risks.
- Tekla Structure Analysis: Analysis models in Tekla are created from selected physical components and include boundary conditions and load inputs prepared for specialist software. Output data then informs structural checks that help refine the physical model with better accuracy.
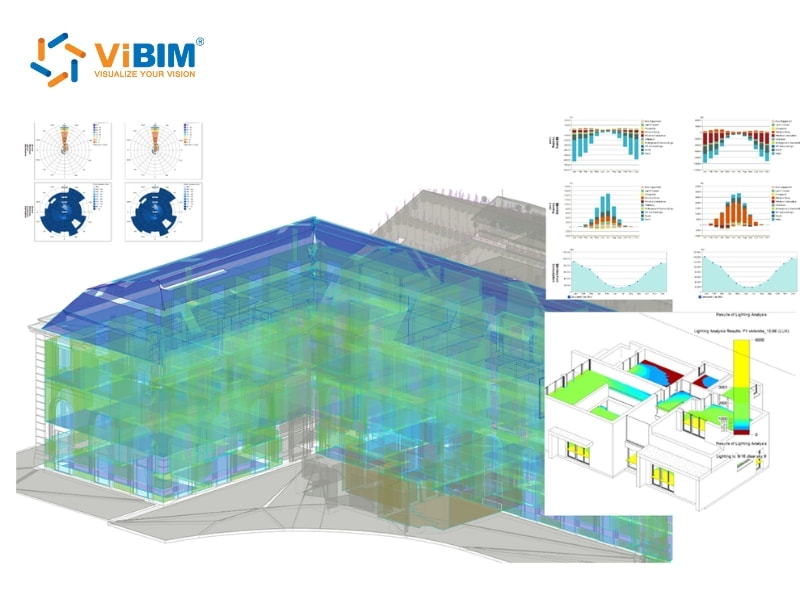
- Lighting Analysis for Revit: Cloud simulations in Lighting Analysis for Revit run daylight studies based on model geometry and environmental conditions. Light levels and distribution charts then help teams adjust openings, shading devices or material choices for improved interior comfort.
Key applications of BIM analytics
BIM analytics turns massive project data into practical insights that support smarter planning, faster execution, and safer operations throughout a building’s lifecycle. Below are its three key applications across design, construction, and facility management.
- Workflow optimization: By analyzing project workflows, BIM analytics detects inefficiencies and recommends changes that help shorten timelines, improve coordination, and reduce overall costs.
- Risk assessment: BIM analytics support predictive management by identifying potential issues before they occur, enabling teams to address them proactively.
- Energy modeling and sustainability: BIM analytics integrates performance data from energy simulations to evaluate HVAC efficiency, lighting design, and insulation performance. These analyses help teams enhance energy use, reduce waste, and achieve sustainability targets throughout a building’s lifecycle.
Which industries benefit from BIM analytics?
BIM analytics provides insights that enhance efficiency, inform decision-making, and promote sustainability across these six sectors. Its applications range from construction planning, infrastructure, real estate development, urban planning to facility management and smart building, helping organizations optimize resources and reduce risks.
This article explains the role of BIM analytics in enhancing decision-making, identifying design issues, optimizing workflows, and facilitating resource planning throughout the project lifecycle. It covered how analytics transforms BIM through data collection, cleaning, visualization, interpretation, and continuous refinement, while highlighting key applications and industries that benefit.
ViBIM focuses on providing Revit modeling outsourcing from Point Cloud data (Scan to BIM), specializing in Revit as the main authoring tool and Autodesk platform, suitable for building surveys, as-built conditions, and design or engineering projects. Contact ViBIM today to discuss your requirements and receive a complimentary quote.
Vietnam BIM Consultancy and Technology Application Company Limited (ViBIM)
- Address: 10th floor, CIT Building, No 6, Alley 15, Duy Tan street, Cau Giay ward, Hanoi, Vietnam
- Phone: +84 944 798 298
- Email: info@vibim.com.vn