A 3D point cloud model records the measured shape of a building, an object, or a site as a dense field of individual points, the input that meshes, CAD drawings, and BIM models are built from. What the cloud holds decides how much detail those models can show.
Every point holds a position, and most also hold scanner readings or labels added later in software, exchanged in file types like E57 and LAS. Laser scanners measure the points directly, whereas photogrammetry calculates them from overlapping photos. Uses run from as-built records of existing buildings to obstacle detection in autonomous vehicles and robots.
The sections below also point to free sample files, explain how clouds are typed by scan structure and by color, and follow the steps from registered scans to a checked model. Since 2014, ViBIM has completed 1,000+ projects, and the advice here on scan types and file delivery comes from that work.
What Is a 3D Point Cloud Model?
A 3D point cloud model is a large set of data points, each a measurement fixed by X, Y, and Z values in a three-dimensional coordinate system, that together represent the external surface of an object or a physical space.
Laser scanners, photogrammetry, and depth cameras produce these points, and one dataset can hold thousands to millions of them. The points are not joined into faces or edges; the shape of a wall or a duct only appears where enough points sit close together.
The parts of the name are explained below:
- 3D: X, Y, and Z stand for width, depth, and height, and each point works like a pixel with a third coordinate. With all three axes, a team can slice the cloud at any height and measure between any two points from the office.
- Word order: A point cloud 3D model names this same dataset with the words reordered. A 3D model point cloud usually does too, but can also mean points sampled from an existing 3D model.
- Model: In this name, “model” means a measured record of real conditions, not built geometry. A point cloud becomes a 3D model only after a modeler or meshing software turns it into surfaces or objects.
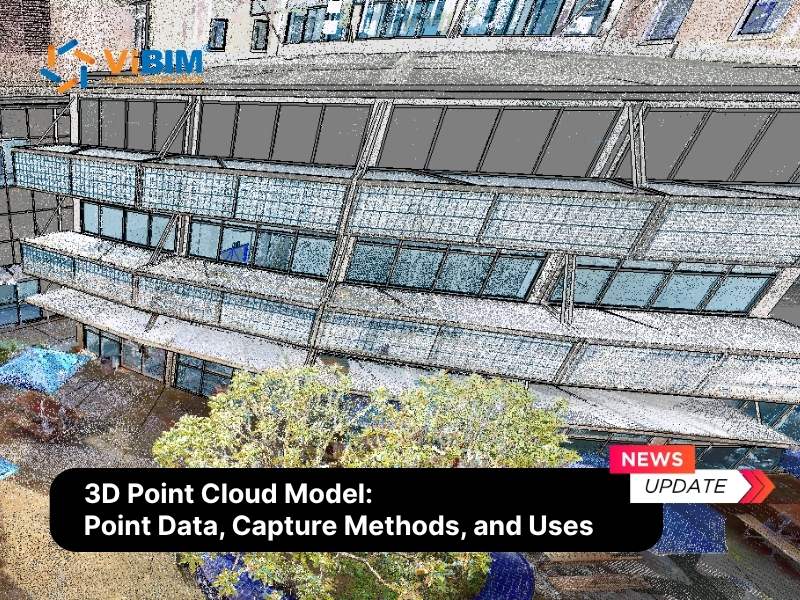
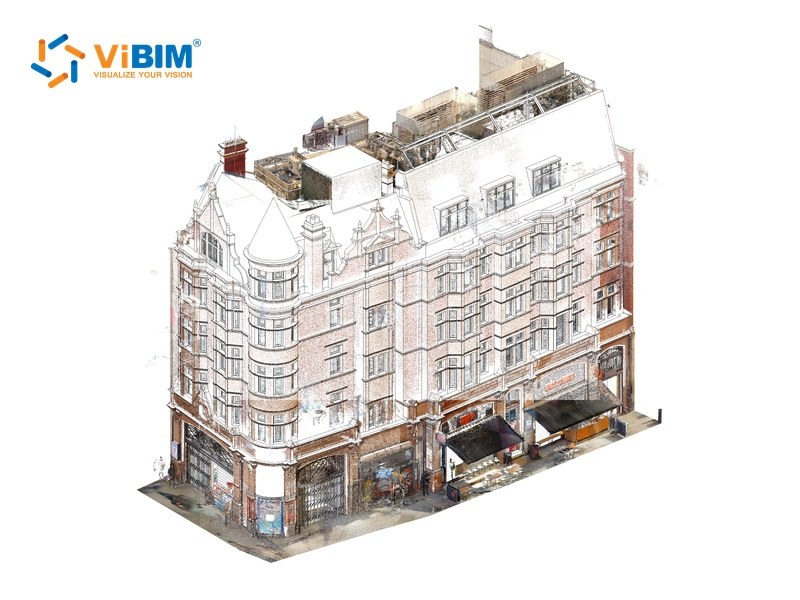
This colorized scan of a corner building records its brick facades, bay windows, rooftop plant, and shopfront awnings as dense points.
What Is 3D Point Cloud Data?
3D point cloud data is the stack of values stored with every point: its position on the X, Y, and Z axes, plus the attributes the capture device or later software adds to it, such as color, intensity, or a classification.
Most of these values are recorded during the scan; normals and classification are usually computed afterward:
| Value | Meaning | Where it comes from |
|---|---|---|
| X, Y, Z coordinates | Where the point sits in space | Recorded at capture |
| RGB color | The color of the surface at that point | Mapped onto points from photos, on the scanner or in software |
| Intensity | How strongly the laser return came back | Recorded at capture |
| Return number | Which reflection of a single laser pulse produced the point | Recorded at capture |
| Timestamp | The moment the point was measured | Recorded at capture |
| Normal | Which way the surface points at that spot | Computed after capture |
| Classification | A label such as ground, building, or vegetation | Computed after capture |
| Point spacing (density) | The gap between neighboring points, a property of the whole cloud | Set by scan settings and distance, widened later by downsampling |
File size grows with the number of points and with every value stored at each one, so large scans are often downsampled to keep one point per set spacing. On libE57.org, one sample of five registered scans drops from 650 million points to 8 million at 50 mm (about 2 in) spacing.
Matterport puts its E57 exports at about 60 MB per scan station for the Pro2 camera. The same points take less space in a compressed format such as LAZ, the lossless compressed form of LAS.
3D Point Cloud File Formats
Point cloud files are stored in formats such as E57, LAS and LAZ, RCP and RCS, PTS and PTX, and PLY or XYZ, and the formats differ in whether the scan grid survives export.
E57 and PTX can keep each scan as the rows and columns a scanner records from one station, while LAS, PTS, and XYZ store a flat list of points. Sample files let a team test a point cloud data format in its own software before project data arrives.
Free 3D Point Cloud Data to Download
Free 3D point cloud data to download is available from the sources below:
- libE57.org: E57 and PTX test scans, from a single scan to a registered pump room.
- Matterport: A sample E57 of a building under construction, an 8.8 GB file.
- SketchUp: Low-resolution RealWorks projects (.rwp) for quick downloads.
- Arrival 3D: Architecture and engineering scans in LAS, E57, PLY, OBJ, and XYZ.
How Are 3D Point Clouds Generated?
Point clouds are generated by scanners, cameras, and photo-based software that measure or calculate the distance to surrounding surfaces: terrestrial laser scanners, mobile and SLAM (simultaneous localization and mapping) scanners, aerial LiDAR (Light Detection and Ranging), photogrammetry, and depth cameras.
Laser scanners record intensity at every point; photogrammetry records color but no intensity:
| Source | How it measures | Color and intensity | Scan grid at capture |
|---|---|---|---|
| Terrestrial laser scanner | A laser sweeps the space from a fixed tripod station | Intensity always, color when photos are taken at the station | Kept per station |
| Mobile and SLAM scanner | A handheld, backpack, or vehicle-mounted scanner tracks its own position while it moves | Intensity, color varies by device | No grid |
| Aerial LiDAR | A drone or aircraft fires laser pulses downward and can log several returns per pulse | Intensity, color only when merged with imagery | No grid |
| Photogrammetry | Software computes points from many overlapping photos | Color always, no intensity | No grid |
| Depth camera | A depth camera projects a light pattern (structured light) or times reflected light (time-of-flight) at short range | Color on RGB-D cameras, intensity varies by device | Varies by device |
Mobile capture leaves a sparser cloud than terrestrial laser scanning, so in practice it caps a whole-building model at about LOD (Level of Development) 300.
LiDAR is the laser measurement behind terrestrial, mobile, and aerial scanning, not the point cloud itself, and photogrammetry produces a point cloud without any laser.
How Many Types of 3D Point Clouds Are There?
There are two main types of point clouds, structured and unstructured, and either type can be colorized or intensity-only, or classified once processing labels its points.
Classified points let software hide or isolate one class, such as vegetation, without deleting it. Computer vision tools call structured and unstructured clouds organized and unorganized.
Structured vs Unstructured Point Clouds
Structured point clouds keep every point indexed to the scanner position and firing angle that recorded it, so each station stays a separate grid; unstructured point clouds drop that index and hold all points as one flat list, as in a unified cloud or a mobile scan.
Registered does not mean unstructured. On libE57.org, a set of aligned scans still carries each station’s pose, its position and orientation. Only unifying the scans into one cloud removes that structure for good, and the change shows in storage, viewing, processing, and file size:
| Structured | Unstructured | |
|---|---|---|
| How points are stored | One grid per scan station, ordered by firing angle | One list of X, Y, Z points with no order |
| Scan positions and panoramic photos | Kept, so a viewer can stand at each station and move between them | Lost |
| Connections between points | None; the grid orders the points but does not join them into surfaces | None |
| Processing | Neighbors are already known, so normals and meshes are computed faster | Neighbors must be found before normals or meshes can be computed |
| File size | Larger than the unified copy | Slightly smaller and easier to load into desktop modeling software |
A modeler who checks details from each scan position needs the structured delivery. Modeling software that accepts only one combined file can take a unified copy, with the structured original kept.
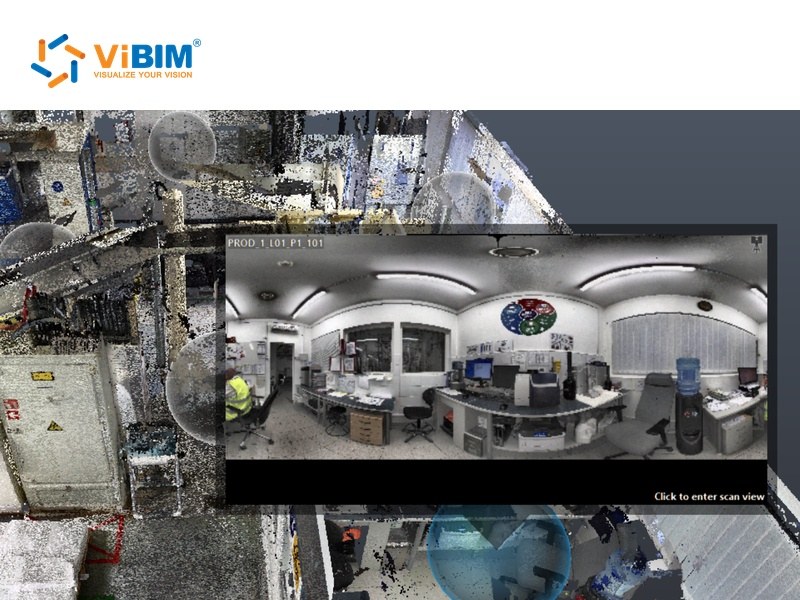
In the structured scan below, each sphere marks a scanner station, and selecting one opens the panoramic photo taken from that spot.
Colorized vs Intensity Point Clouds
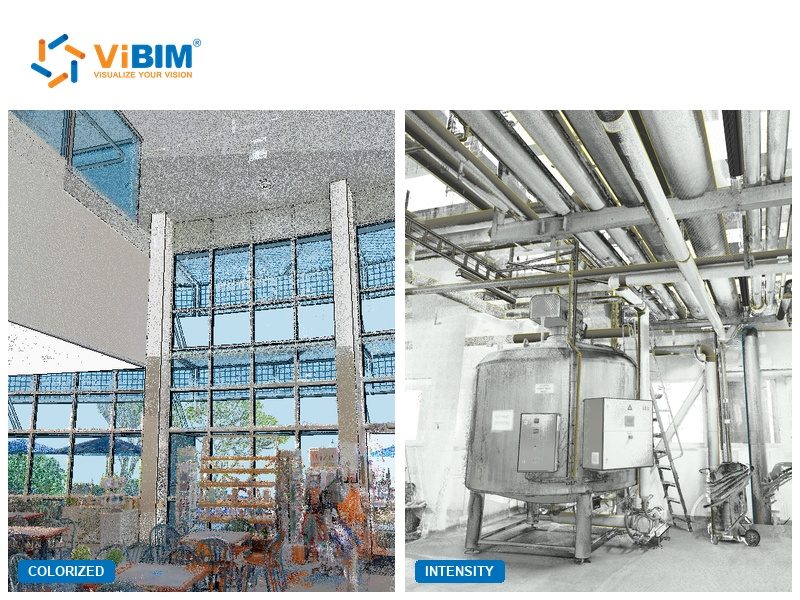
Colorized point clouds show a scan in the surface colors captured by photos, while intensity point clouds show it in greyscale, set by the strength of each laser return alone.
A colorized laser scan keeps its intensity values too, so many viewers can switch between the two displays, and the real choice is made in the field:
| Colorized | Intensity-only | |
|---|---|---|
| Capture needs | Enough light and an extra photo pass at every station | Needs no ambient light, so dark basements and tunnels can be scanned |
| Field time | Longer, since the photo pass adds minutes at every station | Laser pass only |
| What reads clearly | Pipes, signs, and labels by their paint or print | Walls, slabs, and pipe runs; reflective paint and signs stand out |
| Best suited to | Finishes, color-coded systems, and heritage detail | Structure and layout |
The colorized scan keeps the sky and planting beyond the glazing in their real colors, while the intensity scan shows a plant room’s tank, pipes, and ladder in shades of grey.
What Is a 3D Point Cloud Used For?
A point cloud is used for measuring, documenting, and rebuilding real objects and spaces in architecture and construction, land surveying, infrastructure inspection, manufacturing, autonomous vehicles and robotics, heritage preservation, and games and virtual reality.
The uses in each field are explained below:
- Architecture and construction: A point cloud 3D model records the as-built state of an existing building, the starting point for point cloud modeling. A modeler can also produce 2D drawings, with electrical and mechanical equipment data added from site photos, or floor plans with room areas and clear heights for leasing.
- Land surveying: Surveyors map terrain and calculate volumes, such as mine stockpiles or cut and fill on a site, from the measured ground surface.
- Infrastructure inspection: Bridges, tunnels, roads, and power lines are scanned to measure deformation, clearance, and wear without closing them for long.
- Manufacturing: A scanned part is compared with its CAD file to find where it is out of tolerance, or rebuilt as a new CAD model when no drawing exists.
- Autonomous vehicles and robotics: LiDAR sensors rebuild the surroundings as a point cloud many times per second, and the vehicle or robot uses it to detect obstacles and find its way.
- Heritage preservation: Monuments and historic interiors are scanned to keep a measured record before restoration, damage, or loss.
- Games and virtual reality: Real objects and places are scanned to become 3D assets, usually after the points are converted into a textured mesh.
How Do You Create a 3D Model From a Point Cloud?
To create a 3D model from a point cloud, align and clean the scan data, then either let software generate a mesh from the points or have a modeler trace CAD and BIM elements over them, and check the result against the cloud before export.
The steps of a point cloud to 3D model conversion are listed below:
- Register the separate scans as one cloud
- Clean and thin the cloud
- Choose the output: mesh, CAD drawings, or a BIM model
- Build the geometry over the points
- Check the model against the cloud and export it
What Is Point Cloud Registration?
Point cloud registration is the alignment of separate scans into one shared coordinate system by solving the rotation and translation between them, so they read as a single cloud.
Without it, any model repeats every offset between stations, the error that point cloud registration methods remove before modeling starts.
What Is Noise in a 3D Point Cloud?
Noise in a point cloud is any point that does not sit on a real surface, such as stray returns off glass, ghost trails from people walking past, or fuzz along edges.
Left in the cloud, these points read as false surfaces that get modeled as real geometry. Point cloud noise removal separates them from true returns with outlier filters.
What Is the Difference Between Point Clouds and Mesh Models?
The difference between point clouds and mesh models is connection: a point cloud keeps every measurement as a separate point; a mesh joins neighboring points into triangles that form one continuous surface.
A mesh suits viewing and 3D printing; for measuring, any point cloud vs mesh choice favors the cloud, since a mesh fills gaps with unmeasured surface.
How Do You Convert a Point Cloud to BIM?
To convert a point cloud to BIM, a modeler loads the registered cloud into BIM authoring software and rebuilds the building as objects that carry type data, not as the plain lines of a CAD drawing.
That type data lets a team schedule quantities by element type, and each point cloud to BIM workflow sets which elements carry it.
How Do You Convert LiDAR Data Into a 3D Model?
LiDAR data becomes a 3D model through two routes: aerial scans are classified into ground and building points for GIS models, and terrestrial scans are traced into BIM elements like any building scan.
In a 3D LiDAR point cloud, ground returns give a bare-earth terrain model, while first returns keep rooftops, trees, and power lines in a surface model.
Can ChatGPT Create a 3D Model?
Yes, ChatGPT can create simple 3D models by writing code, such as Blender Python or OpenSCAD scripts, that builds the shapes, but it is not built to trace a building scan into a measured model.
Research on AI that reads scan data directly is moving toward a point cloud foundation model, one trained on large sets of 3D scans.
How Does ViBIM Convert Client Point Clouds Into Revit Models?
To convert client point clouds into Revit models, ViBIM quotes the scope in 12–24 hours from a scan sent as RCP, RCS, E57, or a zipped dataset, then models each discipline against the cloud for Revit, IFC, and DWG output.
The ViBIM team builds as-built BIM models for clients across the UK, US, Canada, Australia, and Europe, and every trial project delivered so far has been accepted. Each pair below sets a client scan beside the Revit model traced from it:
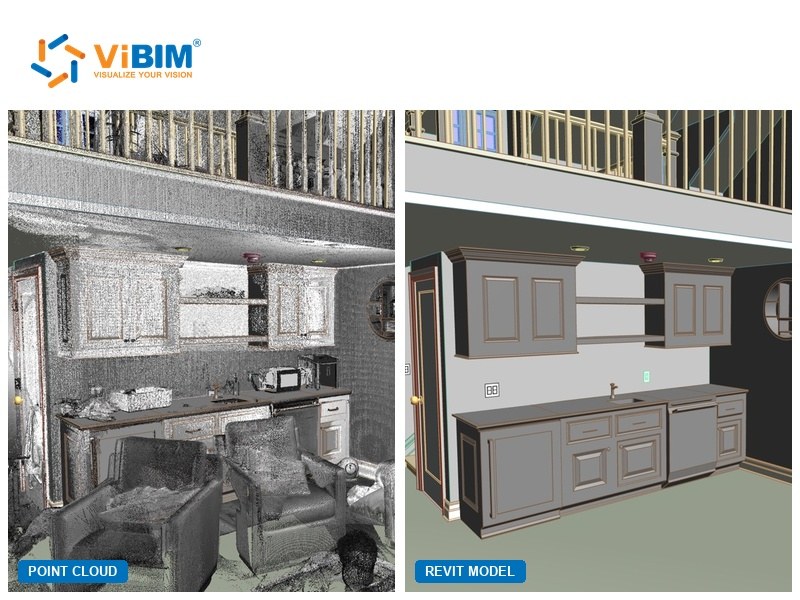
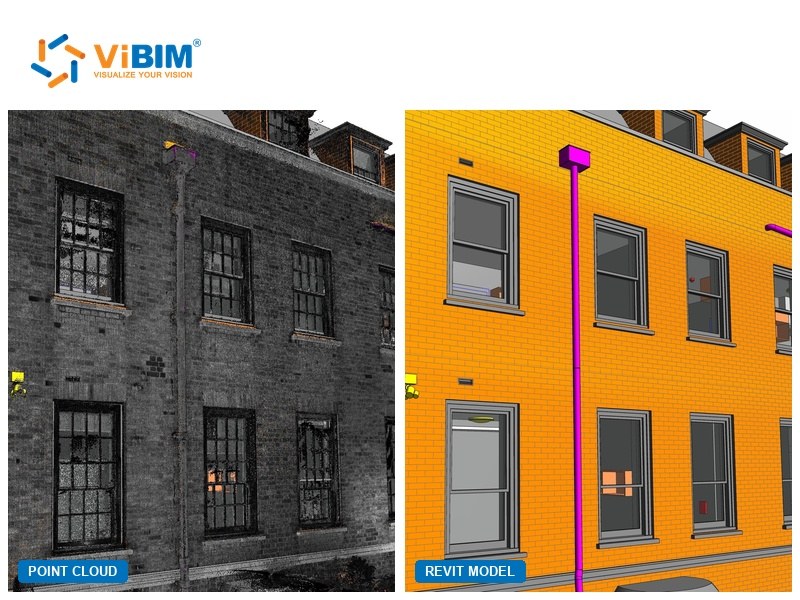
To turn a scan like the two above into a Revit model, new clients can start with one free trial project through ViBIM’s point cloud to BIM services, checked against the source cloud by two independent QC layers before delivery.